Showing posts with label ProgDebug. Show all posts
Showing posts with label ProgDebug. Show all posts
Friday, November 6, 2015
DDD Front-End Debugger
Summary of DDD
The purpose of a debugger such as ddd is to allow you to see what is going on “inside” another
program while it executes—or what another program was doing at the moment it crashed.
ddd can do four main kinds of things (plus other things in support of these) to help you catch
bugs in the act:
• Start your program, specifying anything that might affect its behavior.
• Make your program stop on specified conditions.
• Examine what has happened, when your program has stopped.
• Change things in your program, so you can experiment with correcting the effects of one bug
and go on to learn about another.
Technically speaking, ddd is a front-end to a command-line debugger (called inferior debugger,
because it lies at the layer beneath ddd). ddd supports the following inferior debuggers:
• To debug executable binaries, you can use ddd with gdb, dbx, Ladebug, or xdb.
− gdb, the gnu debugger, is the recommended inferior debugger for ddd. gdb supports
native executables binaries originally written in C, C++, Java, Modula-2, Modula-3, Pascal, Chill, Ada, and FORTRAN. (see section “Using gdb with Different Languages” in
Debugging with gdb, for information on language support in gdb.)
− As an alternative to gdb, you can use ddd with the dbx debugger, as found on several
unix systems. Most dbx incarnations offer fewer features than gdb, and some of the
more advanced dbx features may not be supported by ddd. However, using dbx may be
useful if gdb does not understand or fully support the debugging information as generated
by your compiler.
− As an alternative to gdb and dbx, you can use ddd with Ladebug, as found on Compaq and DEC systems. Ladebug offers fewer features than gdb, and some of the more
advanced Ladebug features may not be supported by ddd. However, using Ladebug may
be useful if gdb or dbx do not understand or fully support the debugging information as
generated by your compiler.
1
− As another alternative to gdb, you can use ddd with the xdb debugger, as found on
hp-ux systems.
2
.
• To debug Java byte code programs, you can use ddd with jdb, the Java debugger, as of jdk
1.1 and later. (ddd has been tested with jdk 1.1 and jdk 1.2.)
• To debug Python programs, you can use ddd with pydb, a Python debugger.
• To debug Perl programs, you can use ddd with the Perl debugger, as of Perl 5.003 and later.
• To debug Bash programs, you need a version Bash that supports extended debugging support.
To get this enhanced version see http://bashdb.sourceforge.net. You will need
version 2.05b-debugger-0.32 or later to work with ddd.
Thursday, December 19, 2013
Wednesday, November 6, 2013

Wednesday, August 14, 2013
Open Source USB Packet capture for Windows ... works on XP, Vista, 7 and 8
[1] USBPcap
USB Packet capture for Windows Tour
This short tour assumes you have installed the latest version of USBPcap and the patched version of Wireshark and rebooted your system. Each of the steps contains short description of what should happen and in some cases gives tips for troubleshooting.
If you feel the information provided there is not complete (it doesn't cover your case), please describe your problem on the USBPcap mailing list.
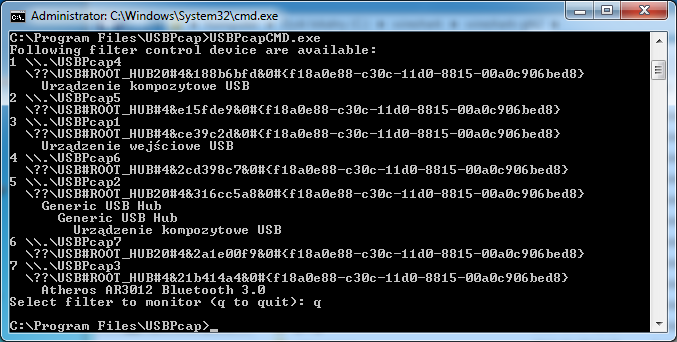
Step 1 - identify the Root Hub you want to monitor
The first step is to connect the device you want to sniff the traffic and identify the Root Hub this device is connected to. In order to do so, launch the USBPcapCMD.exe that is stored in the installation directory. You should be presented with something similiar to the picture below.
Troubleshooting step 1
If for any reason you can't see the list of connected devices make sure you have the USBPcap driver installed and you have restarted your computer after the installation. Please note that if running on 64-bit Windws it is required to run in Test Mode.
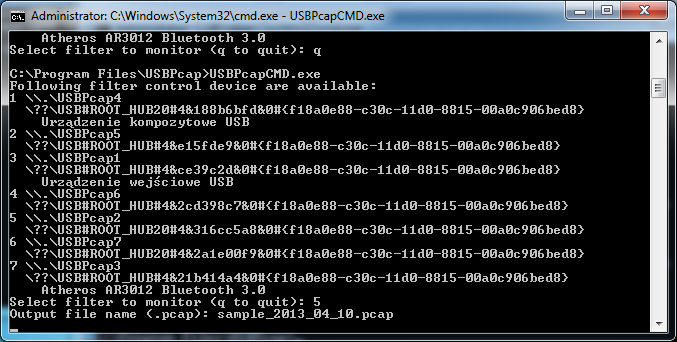
Step 2 - start the capture
So now you know which of the Root Hubs available in your system you want to monitor. Please disconnect the device from your computer - this will allow USBPcap to capture the USB descriptors needed for analysis in Wireshark. Now you can run the USBPcapCMD.exe again and enter your desired output file name. (A careful reader will notice that they can skip the restart part: all that required to get the descriptors in the capture file is to reconnect your device after capture has started.).
We will be capturing the Root Hub that showed the two Hubs connected to it and an composite USB device (it is actually DigiTech RP250).
Now it is time to use the device in order to get packets captured. In this example I have simply started the X-Edit software that controls the DigiTech RP250.
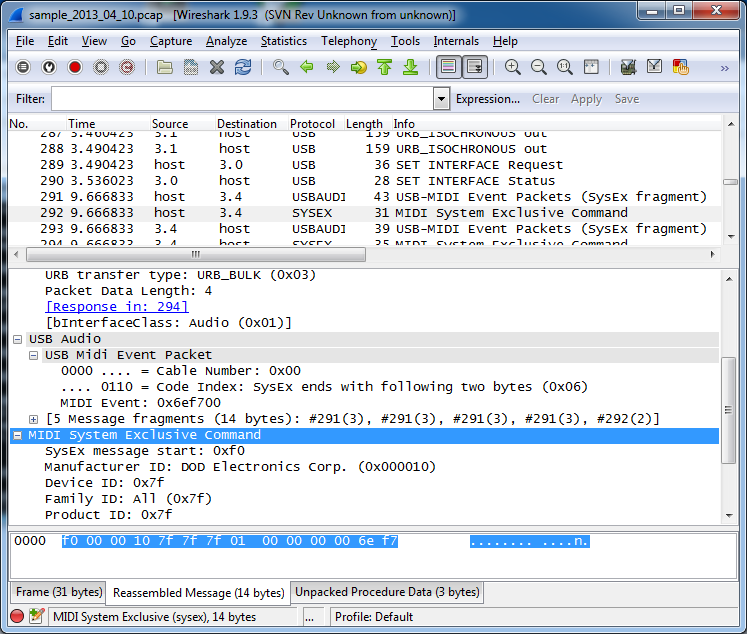
Step 3 - analyse the data
After you're done collecting data, press Ctrl+C and start Wireshark. Once started, open the pcap file you have created in Step 2. You should see the packets allongside with their description. The sample capture is available at the Google code:sample_2013_04_10.pcap
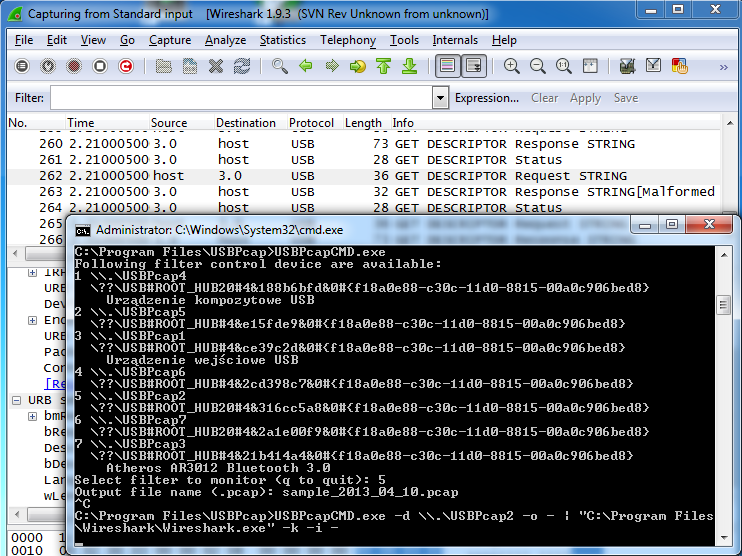
Step 4 - live capture
If you didn't like that in steps 2 and 3 you had to finish capturing before having a chance to look at the data, you can also do a live capture. In order to do so, you must have running the cmd.exe with elevated privileges (as Administrator). Then enter the following command:
USBPcapCMD.exe -d \\.\USBPcap2 -o - | "C:\Program Files\Wireshark\Wireshark.exe" -k -i -This should result in live capture from standard input in Wireshark as shown below.
Step 5 - Contribute to the project :-)
Once you know how to use USBPcap you might want it to work better. There are numerous ways to help, for example:
- Improving project website
- Improving the documentation
- Improving the filter driver
- Improving the sample application
- Improving installation process
- Creating project artwork (icon, website banner, etc.)
- Integrating the project more closely with Wireshark (dumpcap)
- Donating money
Tuesday, June 18, 2013
DebugView Debugging and Diagnosis for .Net Win App
Debug view is a free tool that where your .Net Win app can print out debugging info to.
It is useful for both development and trouble shooting with customer.


It is useful for both development and trouble shooting with customer.


Tuesday, February 15, 2011
Message based different level of Linux App Debugging.
Different level of debugging message from CommsModule-HS
DEBUG:ThdID1185617040 : 0x00
DEBUG:ThdID1185617040 : 0x00
DEBUG:ThdID1185617040 : 0x64 d
DEBUG:ThdID1185617040 : 0x53 S
DEBUG:ThdID1185617040 : 0x73 s
DEBUG:ThdID1185617040 : 0x41 A
DEBUG:ThdID1185617040 : 0x00
DEBUG:ThdID1185617040 : 0xF2 ò
DEBUG:ThdID1185617040 : 0x13
INF:ThdID1185617040 : SpiComm Thread exit.
DEBUG:ThdID1160451216 : Trace SPI Synch Head 0x0C
WARN:ThdID1160451216 : Wrong SPI Synch Head 0xC
DEBUG:ThdID1160451216 : Trace SPI Synch Head 0x41
DEBUG:ThdID1160451216 : Trace SPI Synch Head 0x74
DEBUG:ThdID1160451216 : Received SpiPktInPipe head: 0x0C At
DEBUG:ThdID1160451216 : received head of spi packet 8 Bytes
DEBUG:ThdID1160451216 : Received spi packet head 12 Bytes in total.
INF:ThdID1160451216 : 0x0C At 0x0000 0x64 SsA
INF:ThdID1160451216 : PwrViewStk get valid reply from SpiComm.
DEBUG:ThdID1160451216 : Received PwrView Synch Head PV*VB-
DEBUG:ThdID1160451216 : received data 2 Bytes
DEBUG:ThdID1160451216 : Received PwrView head 4 Bytes in total.
INF:ThdID1160451216 : PwrViewStk get Msg and about to process.
INF:ThdID1160451216 : SpiComm Thd is created by PwrView Stk to do solicited report.
Thread 1160451216:SpiComm Thread 1194005648 is created.
DEBUG:ThdID1160451216 : Sent Spi Packet :
DEBUG:ThdID1160451216 : 0x07
DEBUG:ThdID1160451216 : 0x41 A
DEBUG:ThdID1160451216 : 0x74 t
DEBUG:ThdID1160451216 : 0x00
DEBUG:ThdID1160451216 : 0x00
DEBUG:ThdID1160451216 : 0x64 d
DEBUG:ThdID1160451216 : 0x53 S
DEBUG:ThdID1160451216 : 0x6D m
DEBUG:ThdID1160451216 : 0x43 C
DEBUG:ThdID1160451216 : 0x30 0
DEBUG:ThdID1160451216 : 0xF2 ò
DEBUG:ThdID1160451216 : 0x13
INF:ThdID1160451216 : Passed on Single PwrView Msg.
INF:ThdID1194005648 : Spi Thread is created by Protocol Stack.
spi mode: 0
bits per word: 8
max speed: 8000000 Hz (8000 KHz)
DEBUG:ThdID1194005648 : Trace SPI Synch Head 0x07
WARN:ThdID1194005648 : Wrong SPI Synch Head 0x7
DEBUG:ThdID1194005648 : Trace SPI Synch Head 0x41
DEBUG:ThdID1194005648 : Trace SPI Synch Head 0x74
DEBUG:ThdID1194005648 : Received SpiPktInPipe head: 0x07 At
DEBUG:ThdID1194005648 : received head of spi packet 8 Bytes
DEBUG:ThdID1194005648 : Received spi packet head 12 Bytes in total.
INF:ThdID1194005648 : At 0x0000 0x64 mC0ò 0x13F2, 0x51
DEBUG:ThdID1194005648 : Wait 4 GsnHost Tx Ack.
DEBUG:ThdID1194005648 : GsnHost Acked Cmd Tx.
DEBUG:ThdID1194005648 : Received Synch Head on SpiComm Bus.At
DEBUG:ThdID1194005648 : Received SpiComm Version on SpiComm Bus.0x0000
DEBUG:ThdID1194005648 : received data 8 Bytes
DEBUG:ThdID1194005648 : Received Spi head 12 Bytes in total on Spi Bus.
DEBUG:ThdID1194005648 : GsnHost Acked Rx.
DEBUG:ThdID1194005648 : Received Expected GsnHost Rly.
INF:ThdID1194005648 : At 0x0000 0x64 sA
DEBUG:ThdID1194005648 : Sent Spi Packet :
DEBUG:ThdID1194005648 : 0x0C
DEBUG:ThdID1194005648 : 0x41 A
DEBUG:ThdID1194005648 : 0x74 t
DEBUG:ThdID1194005648 : 0x00
DEBUG:ThdID1194005648 : 0x00
DEBUG:ThdID1194005648 : 0x64 d
DEBUG:ThdID1194005648 : 0x53 S
DEBUG:ThdID1194005648 : 0x73 s
DEBUG:ThdID1194005648 : 0x41 A
DEBUG:ThdID1194005648 : 0x00
DEBUG:ThdID1194005648 : 0xF2 ò
DEBUG:ThdID1194005648 : 0x13
INF:ThdID1194005648 : SpiComm Thread exit.
DEBUG:ThdID1160451216 : Trace SPI Synch Head 0x0C
WARN:ThdID1160451216 : Wrong SPI Synch Head 0xC
DEBUG:ThdID1160451216 : Trace SPI Synch Head 0x41
DEBUG:ThdID1160451216 : Trace SPI Synch Head 0x74
DEBUG:ThdID1160451216 : Received SpiPktInPipe head: 0x0C At
DEBUG:ThdID1160451216 : received head of spi packet 8 Bytes
DEBUG:ThdID1160451216 : Received spi packet head 12 Bytes in total.
INF:ThdID1160451216 : 0x0C At 0x0000 0x64 SsA
INF:ThdID1160451216 : PwrViewStk get valid reply from SpiComm.
DEBUG:ThdID1160451216 : Received PwrView Synch Head PV*VK-
DEBUG:ThdID1160451216 : received data 2 Bytes
DEBUG:ThdID1160451216 : Received PwrView head 4 Bytes in total.
INF:ThdID1160451216 : PwrViewStk get Msg and about to process.
INF:ThdID1160451216 : SpiComm Thd is created by PwrView Stk to do solicited report.
Thread 1160451216:SpiComm Thread 1202394256 is created.
DEBUG:ThdID1160451216 : Sent Spi Packet :
DEBUG:ThdID1160451216 : 0x07
DEBUG:ThdID1160451216 : 0x41 A
DEBUG:ThdID1160451216 : 0x74 t
DEBUG:ThdID1160451216 : 0x00
DEBUG:ThdID1160451216 : 0x00
DEBUG:ThdID1160451216 : 0x64 d
DEBUG:ThdID1160451216 : 0x53 S
DEBUG:ThdID1160451216 : 0x6D m
DEBUG:ThdID1160451216 : 0x43 C
DEBUG:ThdID1160451216 : 0x30 0
DEBUG:ThdID1160451216 : 0xF2 ò
DEBUG:ThdID1160451216 : 0x13
INF:ThdID1160451216 : Passed on Single PwrView Msg.
INF:ThdID1202394256 : Spi Thread is created by Protocol Stack.
spi mode: 0
bits per word: 8
max speed: 8000000 Hz (8000 KHz)
DEBUG:ThdID1202394256 : Trace SPI Synch Head 0x07
WARN:ThdID1202394256 : Wrong SPI Synch Head 0x7
DEBUG:ThdID1202394256 : Trace SPI Synch Head 0x41
DEBUG:ThdID1202394256 : Trace SPI Synch Head 0x74
DEBUG:ThdID1202394256 : Received SpiPktInPipe head: 0x07 At
DEBUG:ThdID1202394256 : received head of spi packet 8 Bytes
DEBUG:ThdID1202394256 : Received spi packet head 12 Bytes in total.
INF:ThdID1202394256 : At 0x0000 0x64 mC0ò 0x13F2, 0x51
DEBUG:ThdID1202394256 : Wait 4 GsnHost Tx Ack.
DEBUG:ThdID1202394256 : GsnHost Acked Cmd Tx.
DEBUG:ThdID1202394256 : Received Synch Head on SpiComm Bus.At
DEBUG:ThdID1202394256 : Received SpiComm Version on SpiComm Bus.0x0000
DEBUG:ThdID1202394256 : received data 8 Bytes
DEBUG:ThdID1202394256 : Received Spi head 12 Bytes in total on Spi Bus.
DEBUG:ThdID1202394256 : GsnHost Acked Rx.
DEBUG:ThdID1202394256 : Received Expected GsnHost Rly.
INF:ThdID1202394256 : At 0x0000 0x64 sA
DEBUG:ThdID1202394256 : Sent Spi Packet :
DEBUG:ThdID1202394256 : 0x0C
DEBUG:ThdID1202394256 : 0x41 A
DEBUG:ThdID1202394256 : 0x74 t
DEBUG:ThdID1202394256 : 0x00
DEBUG:ThdID1202394256 : 0x00
DEBUG:ThdID1202394256 : 0x64 d
DEBUG:ThdID1202394256 : 0x53 S
DEBUG:ThdID1202394256 : 0x73 s
DEBUG:ThdID1202394256 : 0x41 A
DEBUG:ThdID1202394256 : 0x00
DEBUG:ThdID1202394256 : 0xF2 ò
DEBUG:ThdID1202394256 : 0x13
INF:ThdID1202394256 : SpiComm Thread exit.
DEBUG:ThdID1160451216 : Trace SPI Synch Head 0x0C
WARN:ThdID1160451216 : Wrong SPI Synch Head 0xC
DEBUG:ThdID1160451216 : Trace SPI Synch Head 0x41
DEBUG:ThdID1160451216 : Trace SPI Synch Head 0x74
DEBUG:ThdID1160451216 : Received SpiPktInPipe head: 0x0C At
DEBUG:ThdID1160451216 : received head of spi packet 8 Bytes
DEBUG:ThdID1160451216 : Received spi packet head 12 Bytes in total.
INF:ThdID1160451216 : 0x0C At 0x0000 0x64 SsA
INF:ThdID1160451216 : PwrViewStk get valid reply from SpiComm.
INF:ThdID1073863104 : TcpListen socket closed after inactive time out 0 Bytes return.
DEBUG:ThdID1073863104 : No TCP Listen socket avaiable./n
INF:ThdID1160451216 : PwrView Stack thread exit.
DEBUG:ThdID1185617040 : 0x00
DEBUG:ThdID1185617040 : 0x00
DEBUG:ThdID1185617040 : 0x64 d
DEBUG:ThdID1185617040 : 0x53 S
DEBUG:ThdID1185617040 : 0x73 s
DEBUG:ThdID1185617040 : 0x41 A
DEBUG:ThdID1185617040 : 0x00
DEBUG:ThdID1185617040 : 0xF2 ò
DEBUG:ThdID1185617040 : 0x13
INF:ThdID1185617040 : SpiComm Thread exit.
DEBUG:ThdID1160451216 : Trace SPI Synch Head 0x0C
WARN:ThdID1160451216 : Wrong SPI Synch Head 0xC
DEBUG:ThdID1160451216 : Trace SPI Synch Head 0x41
DEBUG:ThdID1160451216 : Trace SPI Synch Head 0x74
DEBUG:ThdID1160451216 : Received SpiPktInPipe head: 0x0C At
DEBUG:ThdID1160451216 : received head of spi packet 8 Bytes
DEBUG:ThdID1160451216 : Received spi packet head 12 Bytes in total.
INF:ThdID1160451216 : 0x0C At 0x0000 0x64 SsA
INF:ThdID1160451216 : PwrViewStk get valid reply from SpiComm.
DEBUG:ThdID1160451216 : Received PwrView Synch Head PV*VB-
DEBUG:ThdID1160451216 : received data 2 Bytes
DEBUG:ThdID1160451216 : Received PwrView head 4 Bytes in total.
INF:ThdID1160451216 : PwrViewStk get Msg and about to process.
INF:ThdID1160451216 : SpiComm Thd is created by PwrView Stk to do solicited report.
Thread 1160451216:SpiComm Thread 1194005648 is created.
DEBUG:ThdID1160451216 : Sent Spi Packet :
DEBUG:ThdID1160451216 : 0x07
DEBUG:ThdID1160451216 : 0x41 A
DEBUG:ThdID1160451216 : 0x74 t
DEBUG:ThdID1160451216 : 0x00
DEBUG:ThdID1160451216 : 0x00
DEBUG:ThdID1160451216 : 0x64 d
DEBUG:ThdID1160451216 : 0x53 S
DEBUG:ThdID1160451216 : 0x6D m
DEBUG:ThdID1160451216 : 0x43 C
DEBUG:ThdID1160451216 : 0x30 0
DEBUG:ThdID1160451216 : 0xF2 ò
DEBUG:ThdID1160451216 : 0x13
INF:ThdID1160451216 : Passed on Single PwrView Msg.
INF:ThdID1194005648 : Spi Thread is created by Protocol Stack.
spi mode: 0
bits per word: 8
max speed: 8000000 Hz (8000 KHz)
DEBUG:ThdID1194005648 : Trace SPI Synch Head 0x07
WARN:ThdID1194005648 : Wrong SPI Synch Head 0x7
DEBUG:ThdID1194005648 : Trace SPI Synch Head 0x41
DEBUG:ThdID1194005648 : Trace SPI Synch Head 0x74
DEBUG:ThdID1194005648 : Received SpiPktInPipe head: 0x07 At
DEBUG:ThdID1194005648 : received head of spi packet 8 Bytes
DEBUG:ThdID1194005648 : Received spi packet head 12 Bytes in total.
INF:ThdID1194005648 : At 0x0000 0x64 mC0ò 0x13F2, 0x51
DEBUG:ThdID1194005648 : Wait 4 GsnHost Tx Ack.
DEBUG:ThdID1194005648 : GsnHost Acked Cmd Tx.
DEBUG:ThdID1194005648 : Received Synch Head on SpiComm Bus.At
DEBUG:ThdID1194005648 : Received SpiComm Version on SpiComm Bus.0x0000
DEBUG:ThdID1194005648 : received data 8 Bytes
DEBUG:ThdID1194005648 : Received Spi head 12 Bytes in total on Spi Bus.
DEBUG:ThdID1194005648 : GsnHost Acked Rx.
DEBUG:ThdID1194005648 : Received Expected GsnHost Rly.
INF:ThdID1194005648 : At 0x0000 0x64 sA
DEBUG:ThdID1194005648 : Sent Spi Packet :
DEBUG:ThdID1194005648 : 0x0C
DEBUG:ThdID1194005648 : 0x41 A
DEBUG:ThdID1194005648 : 0x74 t
DEBUG:ThdID1194005648 : 0x00
DEBUG:ThdID1194005648 : 0x00
DEBUG:ThdID1194005648 : 0x64 d
DEBUG:ThdID1194005648 : 0x53 S
DEBUG:ThdID1194005648 : 0x73 s
DEBUG:ThdID1194005648 : 0x41 A
DEBUG:ThdID1194005648 : 0x00
DEBUG:ThdID1194005648 : 0xF2 ò
DEBUG:ThdID1194005648 : 0x13
INF:ThdID1194005648 : SpiComm Thread exit.
DEBUG:ThdID1160451216 : Trace SPI Synch Head 0x0C
WARN:ThdID1160451216 : Wrong SPI Synch Head 0xC
DEBUG:ThdID1160451216 : Trace SPI Synch Head 0x41
DEBUG:ThdID1160451216 : Trace SPI Synch Head 0x74
DEBUG:ThdID1160451216 : Received SpiPktInPipe head: 0x0C At
DEBUG:ThdID1160451216 : received head of spi packet 8 Bytes
DEBUG:ThdID1160451216 : Received spi packet head 12 Bytes in total.
INF:ThdID1160451216 : 0x0C At 0x0000 0x64 SsA
INF:ThdID1160451216 : PwrViewStk get valid reply from SpiComm.
DEBUG:ThdID1160451216 : Received PwrView Synch Head PV*VK-
DEBUG:ThdID1160451216 : received data 2 Bytes
DEBUG:ThdID1160451216 : Received PwrView head 4 Bytes in total.
INF:ThdID1160451216 : PwrViewStk get Msg and about to process.
INF:ThdID1160451216 : SpiComm Thd is created by PwrView Stk to do solicited report.
Thread 1160451216:SpiComm Thread 1202394256 is created.
DEBUG:ThdID1160451216 : Sent Spi Packet :
DEBUG:ThdID1160451216 : 0x07
DEBUG:ThdID1160451216 : 0x41 A
DEBUG:ThdID1160451216 : 0x74 t
DEBUG:ThdID1160451216 : 0x00
DEBUG:ThdID1160451216 : 0x00
DEBUG:ThdID1160451216 : 0x64 d
DEBUG:ThdID1160451216 : 0x53 S
DEBUG:ThdID1160451216 : 0x6D m
DEBUG:ThdID1160451216 : 0x43 C
DEBUG:ThdID1160451216 : 0x30 0
DEBUG:ThdID1160451216 : 0xF2 ò
DEBUG:ThdID1160451216 : 0x13
INF:ThdID1160451216 : Passed on Single PwrView Msg.
INF:ThdID1202394256 : Spi Thread is created by Protocol Stack.
spi mode: 0
bits per word: 8
max speed: 8000000 Hz (8000 KHz)
DEBUG:ThdID1202394256 : Trace SPI Synch Head 0x07
WARN:ThdID1202394256 : Wrong SPI Synch Head 0x7
DEBUG:ThdID1202394256 : Trace SPI Synch Head 0x41
DEBUG:ThdID1202394256 : Trace SPI Synch Head 0x74
DEBUG:ThdID1202394256 : Received SpiPktInPipe head: 0x07 At
DEBUG:ThdID1202394256 : received head of spi packet 8 Bytes
DEBUG:ThdID1202394256 : Received spi packet head 12 Bytes in total.
INF:ThdID1202394256 : At 0x0000 0x64 mC0ò 0x13F2, 0x51
DEBUG:ThdID1202394256 : Wait 4 GsnHost Tx Ack.
DEBUG:ThdID1202394256 : GsnHost Acked Cmd Tx.
DEBUG:ThdID1202394256 : Received Synch Head on SpiComm Bus.At
DEBUG:ThdID1202394256 : Received SpiComm Version on SpiComm Bus.0x0000
DEBUG:ThdID1202394256 : received data 8 Bytes
DEBUG:ThdID1202394256 : Received Spi head 12 Bytes in total on Spi Bus.
DEBUG:ThdID1202394256 : GsnHost Acked Rx.
DEBUG:ThdID1202394256 : Received Expected GsnHost Rly.
INF:ThdID1202394256 : At 0x0000 0x64 sA
DEBUG:ThdID1202394256 : Sent Spi Packet :
DEBUG:ThdID1202394256 : 0x0C
DEBUG:ThdID1202394256 : 0x41 A
DEBUG:ThdID1202394256 : 0x74 t
DEBUG:ThdID1202394256 : 0x00
DEBUG:ThdID1202394256 : 0x00
DEBUG:ThdID1202394256 : 0x64 d
DEBUG:ThdID1202394256 : 0x53 S
DEBUG:ThdID1202394256 : 0x73 s
DEBUG:ThdID1202394256 : 0x41 A
DEBUG:ThdID1202394256 : 0x00
DEBUG:ThdID1202394256 : 0xF2 ò
DEBUG:ThdID1202394256 : 0x13
INF:ThdID1202394256 : SpiComm Thread exit.
DEBUG:ThdID1160451216 : Trace SPI Synch Head 0x0C
WARN:ThdID1160451216 : Wrong SPI Synch Head 0xC
DEBUG:ThdID1160451216 : Trace SPI Synch Head 0x41
DEBUG:ThdID1160451216 : Trace SPI Synch Head 0x74
DEBUG:ThdID1160451216 : Received SpiPktInPipe head: 0x0C At
DEBUG:ThdID1160451216 : received head of spi packet 8 Bytes
DEBUG:ThdID1160451216 : Received spi packet head 12 Bytes in total.
INF:ThdID1160451216 : 0x0C At 0x0000 0x64 SsA
INF:ThdID1160451216 : PwrViewStk get valid reply from SpiComm.
INF:ThdID1073863104 : TcpListen socket closed after inactive time out 0 Bytes return.
DEBUG:ThdID1073863104 : No TCP Listen socket avaiable./n
INF:ThdID1160451216 : PwrView Stack thread exit.
Sunday, January 9, 2011

Tuesday, January 4, 2011
Linux Segmentation fault debugging.
[1] http://www.cprogramming.com/debugging/segfaults.html
[2] http://prefetch.net/blog/index.php/2006/12/21/generating-core-files-from-gdb/
% gdb example core
Some copyright info
Core was generated by `example'.
Program terminated with signal 11, Segmentation fault.
Some information about loading symbols
#0 0x0804838c in foo() () at t.cpp:4
4 *x = 3;
(gdb)run
(gdb)generate-core-file
Saved corefile core.2575
(gdb)detach
--------------------------------------------------
[3] https://stackoverflow.com/questions/8545931/using-gdb-to-convert-addresses-to-lines
addr2line -e /path/to/non-stripped/.../my-buggy-app 0x4a6889 0x4a8b43 0x4e8765
------------------------------
qyang@lgm-pc:~/Git_Local_DnM_Dev/GitPro-Builder/builder$ addr2line -C -f -e ./build/exports/arm-angstrom-linux-gnueabi-release/bin/gem 0x7aeb8
CPlaybackTrackerManager::RemoveTracker(unsigned long)
??:?
$ addr2line -C -f -e ./build/exports/arm-angstrom-linux-gnueabi-release/bin/gem 0xf18cc
CDPMSClient::GetBugFixList(unsigned long, CCUXmlParser::_TBugFixInfo*)
??:?
---------------------------
/lib/libc-2.25.so(__default_rt_sa_restorer+0x0)[0xb5e59bd0]+0x2cbd0
/usr/lib/lib_resampler.so(ia_error_handler_log.part.0+0x70)[0xb6a886d0]+0x56d0
$ export PATH=$(pwd)/build/exports/host/toolchain/bin/arm-aios63-linux-gnueabi/bin:$PATH
$ arm-aios63-linux-gnueabi-addr2line -Cf -e build/exports/arm-aios63-linux-gnueabi-release/build/resampler/lib_resampler.so 56d0
ia_error_handler_log
/home/doug/current_dev/build/thirdparty/ittiam/src/ia_error_handler.c:85
$ arm-aios63-linux-gnueabi-addr2line -Cf -e build/exports/arm-aios63-linux-gnueabi-release/sysroot/lib/libc-2.25.so +0x2cbd0
__default_rt_sa_restorer
/home/doug/current_dev/build/exports/host/toolchain/src/.build/src/glibc-2.25/signal/../sysdeps/unix/sysv/linux/arm/sigrestorer.S:80
Subscribe to:
Posts (Atom)